Why not to play with data using Helpdesk?!
ACME International is a bank with over 2000 employees. The bank has many departments, each deals with a bunch of external vendors. Recently, ACME has started using SteadyPoint Helpdesk solution to organize all of the requests raised by its internal staff, including financial ones. At the Finance Department, the team is wondering how to use Helpdesk to manipulate financial data and uncover insights. Sometimes, it needs a broader view of monetary operations. For example, a way to track how much the bank is spending on IT-related requests. Helpdesk’s capability expands beyond creating and listing requests. In this blog, we explore how to easily create a yearly spending sheet using user-defined fields, customized views (i.e., filters) and pivot tables.
From day one, ACME has categorized internal requests based on departments. Within the Finance Department, five main sub-departments were added: Accounts Payable, Accounts Receivable, Budgeting and Forecasting, Tax, and Treasury Management.
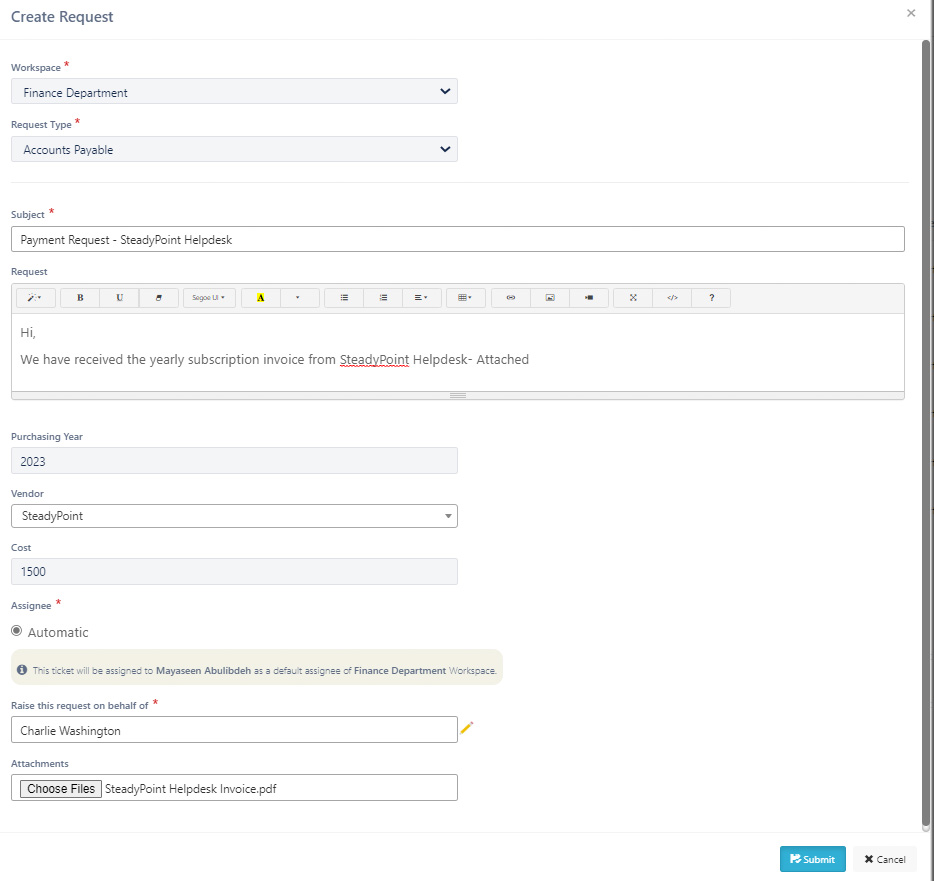
Charlie is an IT employee at ACME and he is in direct contact with technology vendors. When the IT department decides to purchase goods and services from technology vendors, he submits a new ticket on Helpdesk to have the finance team consider the request.
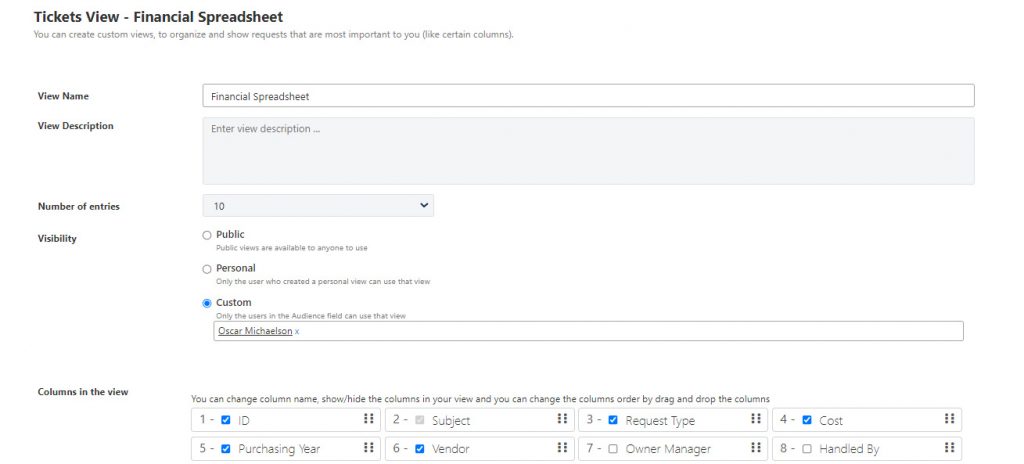
The system admins at ACME have created a custom filter to be viewed by the top management inside the Finance department. The customized view gives people detailed information about the bank transactions and even provides an easy way to export the list of data to Excel and create custom pivot tables to uncover insights and comparisons.
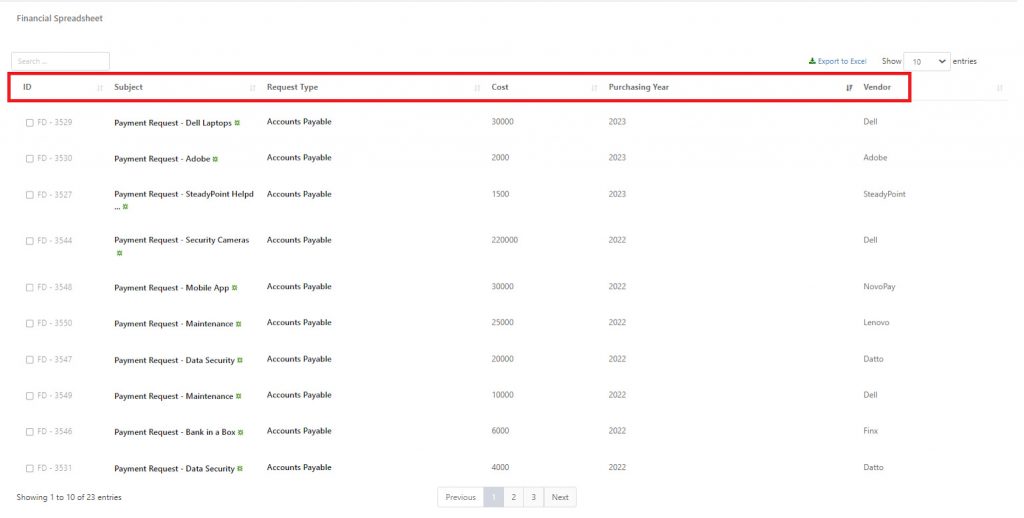
- Create a view showing the required columns
And here we are!
- Export to Excel
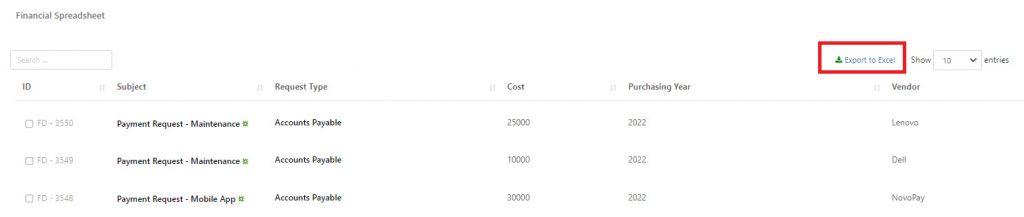
- Open Excel, create a pivot table and uncover insights
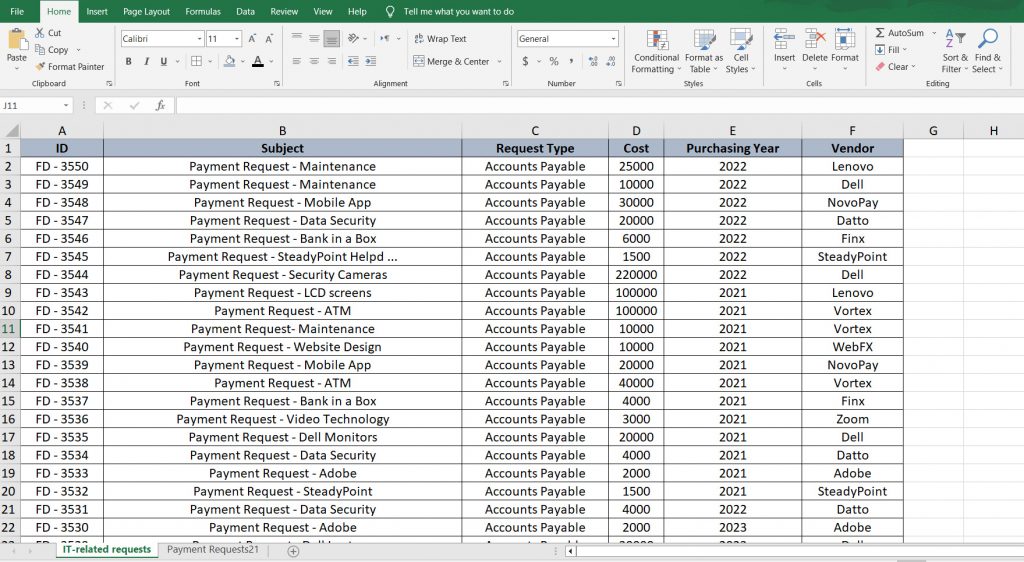
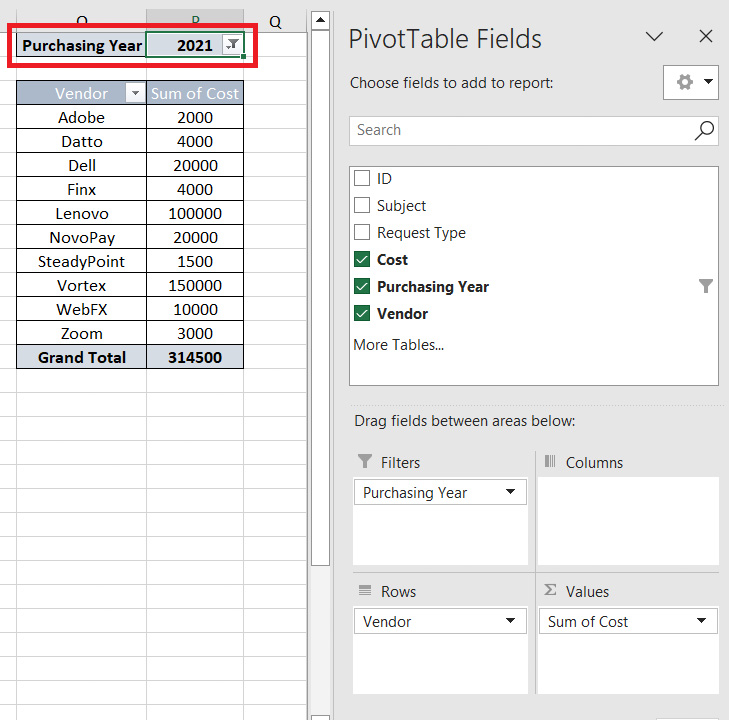
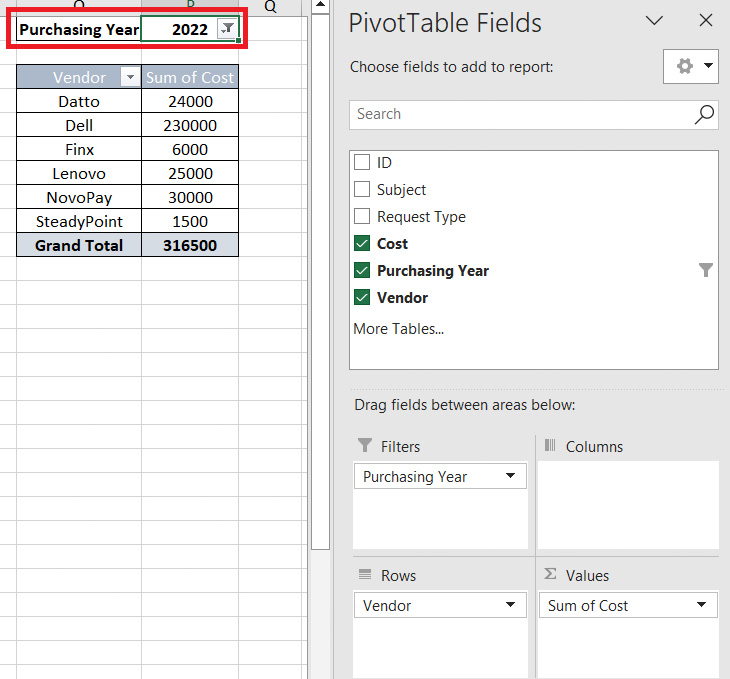
If the Finance Department would like to review ACME’s yearly spending for each vendor, a pivot table makes this easily accessible.
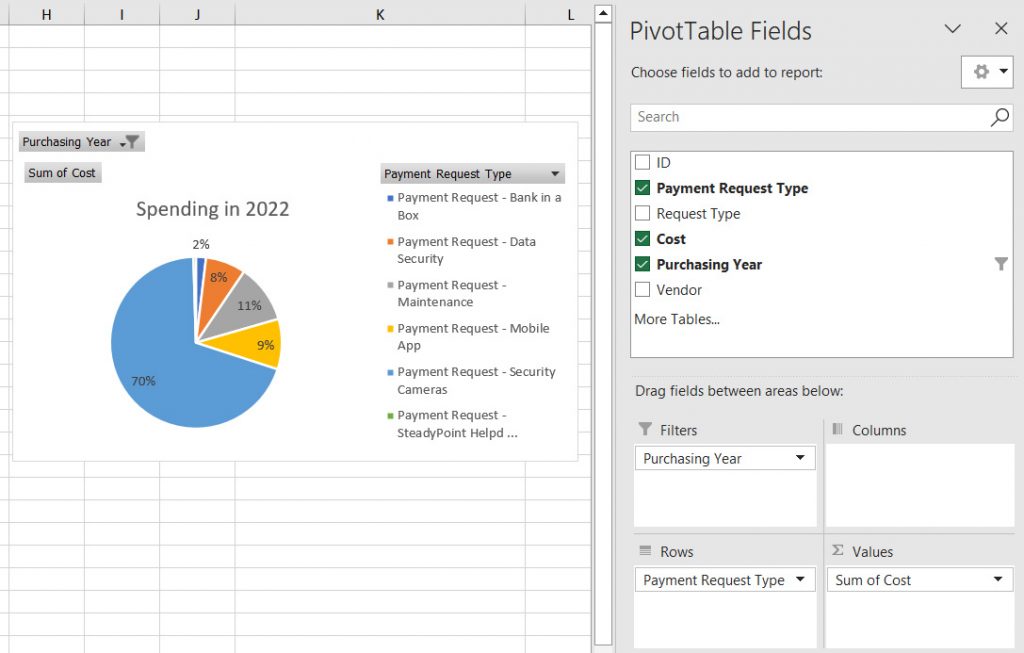
On the other hand, if the top management asks for the annual spending review of 2022, then the Finance team submits an easy-to-read chart that shows the yearly spending. This allows the bank to broaden the focus of its money management.
And now, it’s your turn to play with your data!